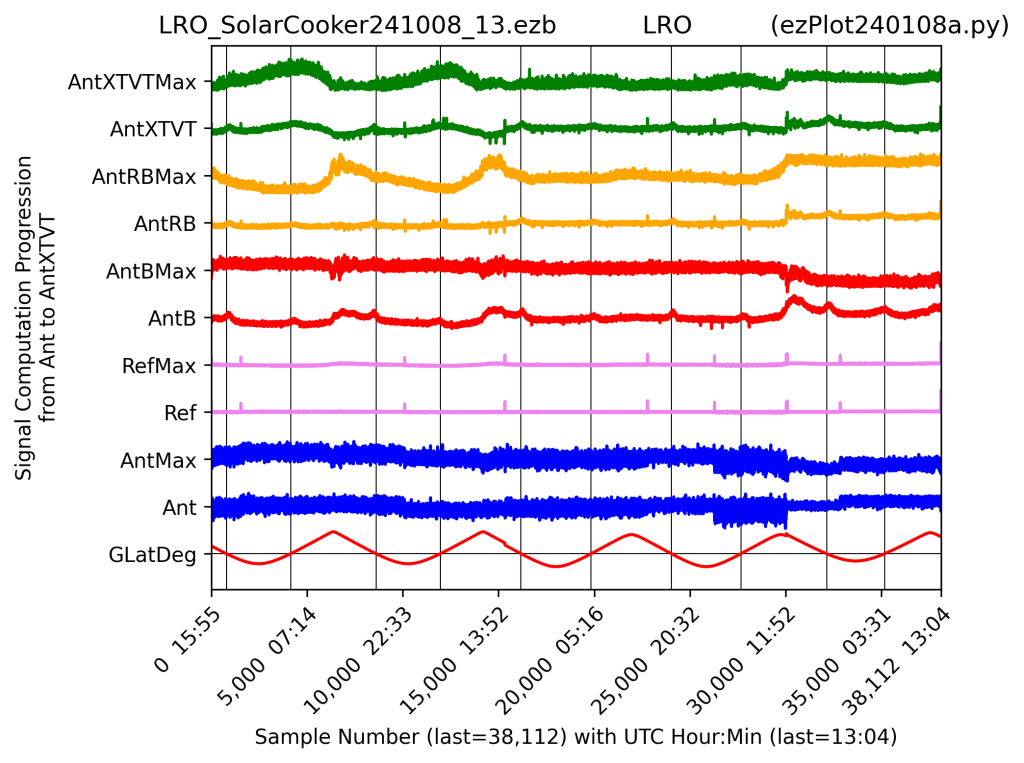
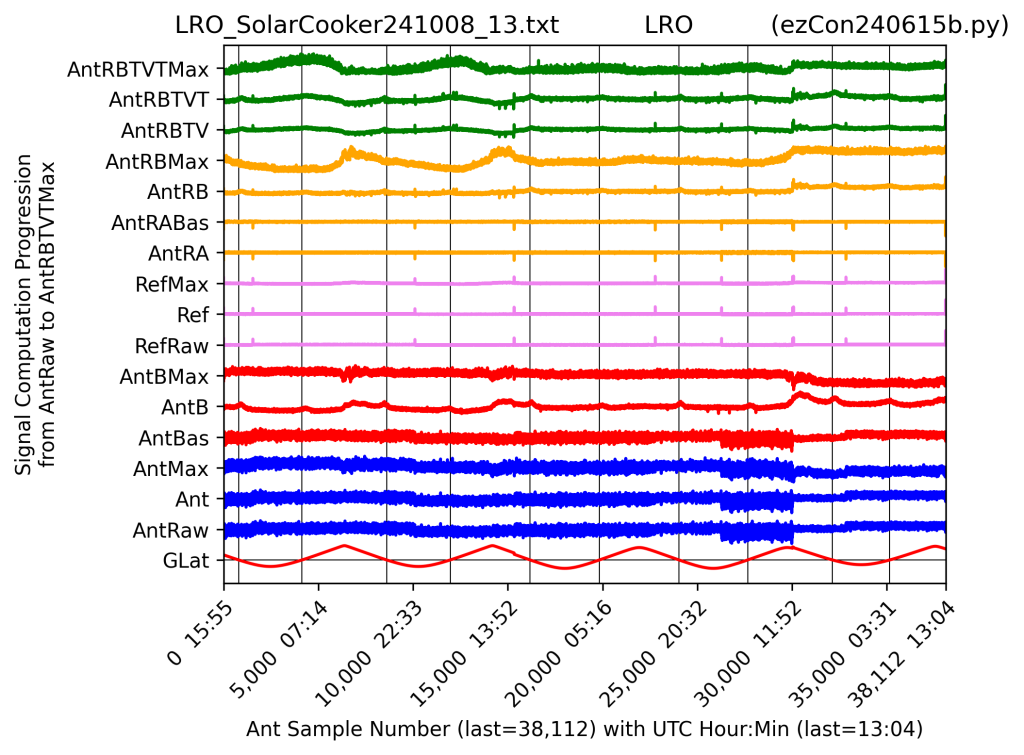
I analysed the data collected by ezCol in the ezRA software suite (Ted Cline) today – after around 1 week of data collection using this new instrument, I have 24 hour drift scans at 3 elevation angles.
Graph from this analysis is shown below.
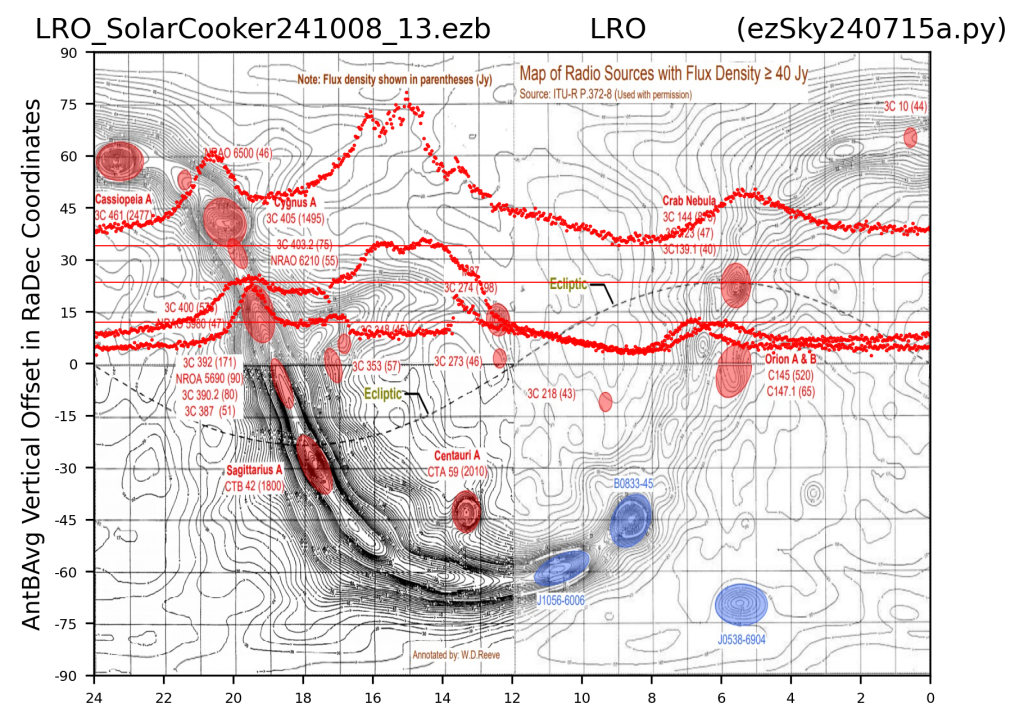
I am not certain what the bump is between Right Ascension 13:00 and 17:00 (x-axis). Is it the sun? Or something else?
Andy